


Compton CCD, Los Angeles County, California
About
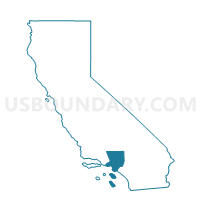
Outline

Summary
| Unique Area Identifier | 124463 |
| Name | Compton CCD |
| County | Los Angeles County |
| State | California |
| Area (square miles) | 45.67 |
| Land Area (square miles) | 45.20 |
| Water Area (square miles) | 0.47 |
| % of Land Area | 98.96 |
| % of Water Area | 1.04 |
| Latitude of the Internal Point | 33.86964150 |
| Longtitude of the Internal Point | -118.24518470 |
| Total Population | 342,576 |
| Total Housing Units | 89,732 |
| Total Households | 85,419 |
| Median Age | 31.1 |
Maps

Graphs
Select a template below for downloading or customizing gragh for Compton CCD, Los Angeles County, California


Neighbors
Neighoring County Subdivision (by Name) Neighboring County Subdivision on the Map
- Downey-Norwalk CCD, Los Angeles County, CA
- Long Beach-Lakewood CCD, Los Angeles County, CA
- Los Angeles CCD, Los Angeles County, CA
- South Gate-East Los Angeles CCD, Los Angeles County, CA
Top 10 Neighboring Place (by Population) Neighboring Place on the Map
- Los Angeles city, CA (3,792,621)
- Long Beach city, CA (462,257)
- Compton city, CA (96,455)
- South Gate city, CA (94,396)
- Carson city, CA (91,714)
- Lynwood city, CA (69,772)
- Florence-Graham CDP, CA (63,387)
- Paramount city, CA (54,098)
- Willowbrook CDP, CA (35,983)
- West Carson CDP, CA (21,699)
Top 10 Neighboring Unified School District (by Population) Neighboring Unified School District on the Map
- Los Angeles Unified School District, CA (4,541,134)
- Long Beach Unified School District, CA (510,940)
- Compton Unified School District, CA (154,769)
- Downey Unified School District, CA (120,994)
- Paramount Unified School District, CA (77,645)
- Lynwood Unified School District, CA (68,397)
Top 10 Neighboring State Legislative District Lower Chamber (by Population) Neighboring State Legislative District Lower Chamber on the Map
- Assembly District 52, CA (451,939)
- Assembly District 55, CA (429,934)
- Assembly District 51, CA (427,453)
- Assembly District 48, CA (424,914)
- Assembly District 50, CA (422,607)
Top 10 Neighboring State Legislative District Upper Chamber (by Population) Neighboring State Legislative District Upper Chamber on the Map
- State Senate District 28, CA (879,674)
- State Senate District 25, CA (860,352)
- State Senate District 27, CA (857,163)
- State Senate District 30, CA (848,551)
Top 10 Neighboring 111th Congressional District (by Population) Neighboring 111th Congressional District on the Map
- Congressional District 35, CA (662,413)
- Congressional District 36, CA (659,385)
- Congressional District 37, CA (648,847)
- Congressional District 39, CA (643,115)
Top 10 Neighboring Census Tract (by Population) Neighboring Census Tract on the Map
- Census Tract 5436.02, Los Angeles County, CA (7,762)
- Census Tract 5703.01, Los Angeles County, CA (7,330)
- Census Tract 5414, Los Angeles County, CA (7,312)
- Census Tract 5362, Los Angeles County, CA (7,289)
- Census Tract 5433.06, Los Angeles County, CA (7,214)
- Census Tract 5438.02, Los Angeles County, CA (7,126)
- Census Tract 5437.02, Los Angeles County, CA (7,083)
- Census Tract 5400, Los Angeles County, CA (6,973)
- Census Tract 5401.02, Los Angeles County, CA (6,972)
- Census Tract 5422, Los Angeles County, CA (6,962)
Top 10 Neighboring 5-Digit ZIP Code Tabulation Area (by Population) Neighboring 5-Digit ZIP Code Tabulation Area on the Map
- 90280, CA (94,396)
- 90805, CA (93,524)
- 90262, CA (69,745)
- 90745, CA (57,251)
- 90723, CA (54,099)
- 90744, CA (53,815)
- 90221, CA (53,704)
- 90002, CA (51,223)
- 90220, CA (49,328)
- 90501, CA (43,180)
Data
Demographic, Population, Households, and Housing Units
** Data sources from census 2010 **
Show Data on Map
Download Full List as CSV
Download Quick Sheet as CSV
| Subject | This Area | Los Angeles County | California | National |
|---|---|---|---|---|
| POPULATION | ||||
| Total Population Map | 342,576 | 9,818,605 | 37,253,956 | 308,745,538 |
| POPULATION, HISPANIC OR LATINO ORIGIN | ||||
| Not Hispanic or Latino Map | 136,233 | 5,130,716 | 23,240,237 | 258,267,944 |
| Hispanic or Latino Map | 206,343 | 4,687,889 | 14,013,719 | 50,477,594 |
| POPULATION, RACE | ||||
| White alone Map | 97,690 | 4,936,599 | 21,453,934 | 223,553,265 |
| Black or African American alone Map | 83,196 | 856,874 | 2,299,072 | 38,929,319 |
| American Indian and Alaska Native alone Map | 2,303 | 72,828 | 362,801 | 2,932,248 |
| Asian alone Map | 31,327 | 1,346,865 | 4,861,007 | 14,674,252 |
| Native Hawaiian and Other Pacific Islander alone Map | 3,834 | 26,094 | 144,386 | 540,013 |
| Some Other Race alone Map | 111,094 | 2,140,632 | 6,317,372 | 19,107,368 |
| Two or More Races Map | 13,132 | 438,713 | 1,815,384 | 9,009,073 |
| POPULATION, SEX | ||||
| Male Map | 165,667 | 4,839,654 | 18,517,830 | 151,781,326 |
| Female Map | 176,909 | 4,978,951 | 18,736,126 | 156,964,212 |
| POPULATION, AGE (18 YEARS) | ||||
| 18 years and over Map | 241,201 | 7,416,397 | 27,958,916 | 234,564,071 |
| Under 18 years | 101,375 | 2,402,208 | 9,295,040 | 74,181,467 |
| POPULATION, AGE | ||||
| Under 5 years | 27,216 | 645,793 | 2,531,333 | 20,201,362 |
| 5 to 9 years | 26,702 | 633,690 | 2,505,839 | 20,348,657 |
| 10 to 14 years | 28,828 | 678,845 | 2,590,930 | 20,677,194 |
| 15 to 17 years | 18,629 | 443,880 | 1,666,938 | 12,954,254 |
| 18 and 19 years | 12,317 | 309,750 | 1,157,002 | 9,086,089 |
| 20 years | 5,965 | 153,466 | 573,642 | 4,519,129 |
| 21 years | 5,578 | 148,530 | 555,775 | 4,354,294 |
| 22 to 24 years | 16,308 | 450,792 | 1,636,532 | 12,712,576 |
| 25 to 29 years | 24,283 | 759,602 | 2,744,409 | 21,101,849 |
| 30 to 34 years | 23,196 | 716,129 | 2,573,468 | 19,962,099 |
| 35 to 39 years | 23,057 | 715,635 | 2,573,579 | 20,179,642 |
| 40 to 44 years | 23,022 | 714,691 | 2,609,131 | 20,890,964 |
| 45 to 49 years | 22,617 | 706,742 | 2,689,819 | 22,708,591 |
| 50 to 54 years | 21,088 | 662,205 | 2,562,552 | 22,298,125 |
| 55 to 59 years | 17,587 | 560,920 | 2,204,296 | 19,664,805 |
| 60 and 61 years | 5,879 | 195,467 | 786,276 | 7,113,727 |
| 62 to 64 years | 7,652 | 256,769 | 1,045,921 | 9,704,197 |
| 65 and 66 years | 4,459 | 141,151 | 568,817 | 5,319,902 |
| 67 to 69 years | 5,916 | 182,136 | 734,741 | 7,115,361 |
| 70 to 74 years | 8,294 | 245,183 | 971,778 | 9,278,166 |
| 75 to 79 years | 6,135 | 192,881 | 766,971 | 7,317,795 |
| 80 to 84 years | 4,275 | 152,722 | 603,239 | 5,743,327 |
| 85 years and over | 3,573 | 151,626 | 600,968 | 5,493,433 |
| MEDIAN AGE BY SEX | ||||
| Both sexes Map | 31.10 | 34.80 | 35.20 | 37.20 |
| Male Map | 29.80 | 33.60 | 34.00 | 35.80 |
| Female Map | 32.50 | 35.90 | 36.30 | 38.50 |
| HOUSEHOLDS | ||||
| Total Households Map | 85,419 | 3,241,204 | 12,577,498 | 116,716,292 |
| HOUSEHOLDS, HOUSEHOLD TYPE | ||||
| Family households: Map | 70,612 | 2,194,080 | 8,642,473 | 77,538,296 |
| Husband-wife family Map | 43,296 | 1,480,665 | 6,213,310 | 56,510,377 |
| Other family: Map | 27,316 | 713,415 | 2,429,163 | 21,027,919 |
| Male householder, no wife present Map | 7,580 | 216,368 | 752,347 | 5,777,570 |
| Female householder, no husband present Map | 19,736 | 497,047 | 1,676,816 | 15,250,349 |
| Nonfamily households: Map | 14,807 | 1,047,124 | 3,935,025 | 39,177,996 |
| Householder living alone Map | 11,635 | 784,928 | 2,929,442 | 31,204,909 |
| Householder not living alone Map | 3,172 | 262,196 | 1,005,583 | 7,973,087 |
| HOUSEHOLDS, HISPANIC OR LATINO ORIGIN OF HOUSEHOLDER | ||||
| Not Hispanic or Latino householder: Map | 44,407 | 2,086,572 | 9,192,322 | 103,254,926 |
| Hispanic or Latino householder: Map | 41,012 | 1,154,632 | 3,385,176 | 13,461,366 |
| HOUSEHOLDS, RACE OF HOUSEHOLDER | ||||
| Householder who is White alone | 22,882 | 1,802,980 | 8,129,331 | 89,754,352 |
| Householder who is Black or African American alone | 27,841 | 330,737 | 835,651 | 14,129,983 |
| Householder who is American Indian and Alaska Native alone | 559 | 22,120 | 113,235 | 939,707 |
| Householder who is Asian alone | 8,633 | 450,325 | 1,529,789 | 4,632,164 |
| Householder who is Native Hawaiian and Other Pacific Islander alone | 747 | 6,703 | 38,238 | 143,932 |
| Householder who is Some Other Race alone | 21,888 | 511,783 | 1,497,993 | 4,916,427 |
| Householder who is Two or More Races | 2,869 | 116,556 | 433,261 | 2,199,727 |
| HOUSEHOLDS, HOUSEHOLD TYPE BY HOUSEHOLD SIZE | ||||
| Family households: Map | 70,612 | 2,194,080 | 8,642,473 | 77,538,296 |
| 2-person household Map | 13,868 | 649,627 | 2,887,696 | 31,882,616 |
| 3-person household Map | 13,732 | 491,991 | 1,904,697 | 17,765,829 |
| 4-person household Map | 13,917 | 472,144 | 1,823,355 | 15,214,075 |
| 5-person household Map | 11,189 | 278,178 | 1,018,257 | 7,411,997 |
| 6-person household Map | 7,085 | 142,574 | 497,773 | 3,026,278 |
| 7-or-more-person household Map | 10,821 | 159,566 | 510,695 | 2,237,501 |
| Nonfamily households: Map | 14,807 | 1,047,124 | 3,935,025 | 39,177,996 |
| 1-person household Map | 11,635 | 784,928 | 2,929,442 | 31,204,909 |
| 2-person household Map | 2,238 | 203,376 | 766,106 | 6,360,012 |
| 3-person household Map | 450 | 34,946 | 139,115 | 992,156 |
| 4-person household Map | 185 | 13,883 | 60,096 | 411,171 |
| 5-person household Map | 132 | 5,388 | 22,151 | 126,634 |
| 6-person household Map | 80 | 2,382 | 9,698 | 48,421 |
| 7-or-more-person household Map | 87 | 2,221 | 8,417 | 34,693 |
| HOUSING UNITS | ||||
| Total Housing Units Map | 89,732 | 3,445,076 | 13,680,081 | 131,704,730 |
| HOUSING UNITS, OCCUPANCY STATUS | ||||
| Occupied Map | 85,419 | 3,241,204 | 12,577,498 | 116,716,292 |
| Vacant Map | 4,313 | 203,872 | 1,102,583 | 14,988,438 |
| HOUSING UNITS, OCCUPIED, TENURE | ||||
| Owned with a mortgage or a loan Map | 42,960 | 1,227,146 | 5,465,345 | 52,979,430 |
| Owned free and clear Map | 10,325 | 317,603 | 1,570,026 | 23,006,644 |
| Renter occupied Map | 32,134 | 1,696,455 | 5,542,127 | 40,730,218 |
| HOUSING UNITS, VACANT, VACANCY STATUS | ||||
| For rent Map | 1,612 | 104,960 | 374,610 | 4,137,567 |
| Rented, not occupied Map | 90 | 4,994 | 20,347 | 206,825 |
| For sale only Map | 1,087 | 26,808 | 154,775 | 1,896,796 |
| Sold, not occupied Map | 213 | 6,726 | 34,288 | 421,032 |
| For seasonal, recreational, or occasional use Map | 119 | 19,099 | 302,815 | 4,649,298 |
| For migrant workers Map | 0 | 109 | 2,100 | 24,161 |
| Other vacant Map | 1,192 | 41,176 | 213,648 | 3,652,759 |
| HOUSING UNITS, OCCUPIED, AVERAGE HOUSEHOLD SIZE BY TENURE | ||||
| Total: Map | 3.93 | 2.98 | 2.90 | 2.58 |
| Owner occupied Map | 3.91 | 3.16 | 2.95 | 2.65 |
| Renter occupied Map | 3.98 | 2.81 | 2.83 | 2.44 |
| HOUSING UNITS, OCCUPIED, TENURE BY RACE OF HOUSEHOLDER | ||||
| Owner occupied: Map | 53,285 | 1,544,749 | 7,035,371 | 75,986,074 |
| Householder who is White alone Map | 14,990 | 959,821 | 4,996,053 | 63,446,275 |
| Householder who is Black or African American alone Map | 18,472 | 119,296 | 310,834 | 6,261,464 |
| Householder who is American Indian and Alaska Native alone Map | 332 | 8,657 | 52,963 | 509,588 |
| Householder who is Asian alone Map | 6,315 | 233,256 | 878,924 | 2,688,861 |
| Householder who is Native Hawaiian and Other Pacific Islander alone Map | 379 | 2,479 | 16,570 | 61,911 |
| Householder who is Some Other Race alone Map | 11,102 | 176,605 | 589,196 | 1,975,817 |
| Householder who is Two or More Races Map | 1,695 | 44,635 | 190,831 | 1,042,158 |
| Renter occupied: Map | 32,134 | 1,696,455 | 5,542,127 | 40,730,218 |
| Householder who is White alone Map | 7,892 | 843,159 | 3,133,278 | 26,308,077 |
| Householder who is Black or African American alone Map | 9,369 | 211,441 | 524,817 | 7,868,519 |
| Householder who is American Indian and Alaska Native alone Map | 227 | 13,463 | 60,272 | 430,119 |
| Householder who is Asian alone Map | 2,318 | 217,069 | 650,865 | 1,943,303 |
| Householder who is Native Hawaiian and Other Pacific Islander alone Map | 368 | 4,224 | 21,668 | 82,021 |
| Householder who is Some Other Race alone Map | 10,786 | 335,178 | 908,797 | 2,940,610 |
| Householder who is Two or More Races Map | 1,174 | 71,921 | 242,430 | 1,157,569 |
| HOUSING UNITS, OCCUPIED, TENURE BY HISPANIC OR LATINO ORIGIN OF HOUSEHOLDER | ||||
| Owner occupied: Map | 53,285 | 1,544,749 | 7,035,371 | 75,986,074 |
| Not Hispanic or Latino householder Map | 30,900 | 1,083,925 | 5,529,138 | 69,617,625 |
| Hispanic or Latino householder Map | 22,385 | 460,824 | 1,506,233 | 6,368,449 |
| Renter occupied: Map | 32,134 | 1,696,455 | 5,542,127 | 40,730,218 |
| Not Hispanic or Latino householder Map | 13,507 | 1,002,647 | 3,663,184 | 33,637,301 |
| Hispanic or Latino householder Map | 18,627 | 693,808 | 1,878,943 | 7,092,917 |
| HOUSING UNITS, OCCUPIED, TENURE BY HOUSEHOLD SIZE | ||||
| Owner occupied: Map | 53,285 | 1,544,749 | 7,035,371 | 75,986,074 |
| 1-person household Map | 7,310 | 281,042 | 1,340,915 | 16,453,569 |
| 2-person household Map | 11,117 | 435,828 | 2,269,063 | 27,618,605 |
| 3-person household Map | 8,784 | 264,854 | 1,164,562 | 12,517,563 |
| 4-person household Map | 8,336 | 258,732 | 1,129,739 | 10,998,793 |
| 5-person household Map | 6,508 | 142,604 | 577,673 | 5,057,765 |
| 6-person household Map | 4,146 | 72,685 | 273,058 | 1,965,796 |
| 7-or-more-person household Map | 7,084 | 89,004 | 280,361 | 1,373,983 |
| Renter occupied: Map | 32,134 | 1,696,455 | 5,542,127 | 40,730,218 |
| 1-person household Map | 4,325 | 503,886 | 1,588,527 | 14,751,340 |
| 2-person household Map | 4,989 | 417,175 | 1,384,739 | 10,624,023 |
| 3-person household Map | 5,398 | 262,083 | 879,250 | 6,240,422 |
| 4-person household Map | 5,766 | 227,295 | 753,712 | 4,626,453 |
| 5-person household Map | 4,813 | 140,962 | 462,735 | 2,480,866 |
| 6-person household Map | 3,019 | 72,271 | 234,413 | 1,108,903 |
| 7-or-more-person household Map | 3,824 | 72,783 | 238,751 | 898,211 |
Loading...